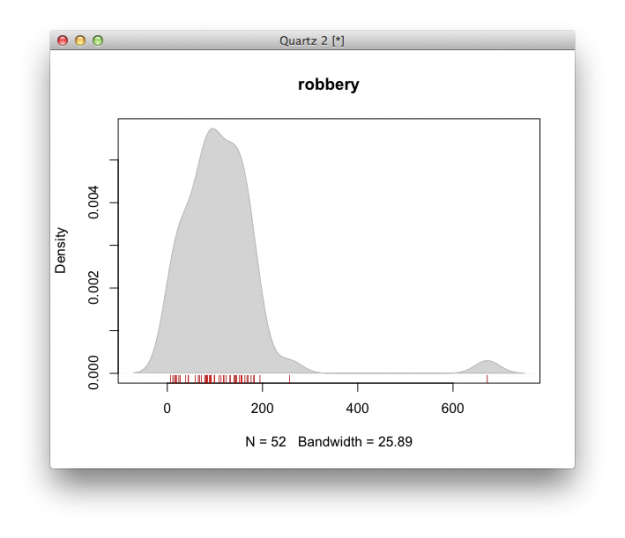
Single data points from a large dataset can make it more relatable, but those individual numbers don’t mean much without something to compare to. That’s where distributions come in.